To locate inefficient synchronization in your code, you may run and explore the data provided by a hardware event-based sampling analysis type with the stack collection enabled.
Locating Synchronization on the Timeline
Open the data collected during the analysis in the Hardware Events viewpoint:

|
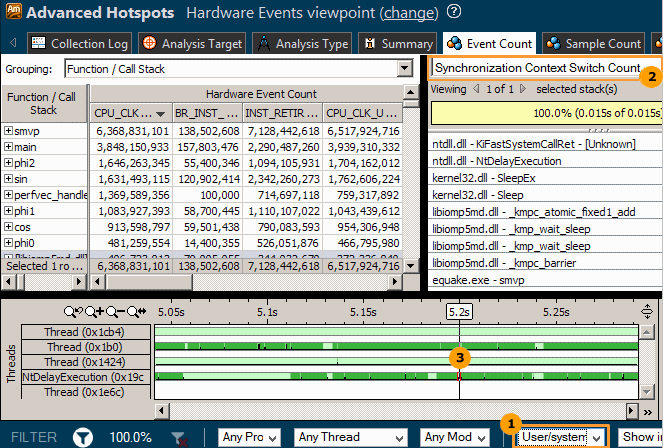
Select the User/system functionscall stack mode to display both user and system functions in the Call Stack pane. |
|
In the Call Stack pane, select the Synchronization Context Switch Count type from the drop-down menu to see a call stack for the synchronization context switch selected in the Timeline pane. |
|
Locate a frequent synchronization on the timeline and hover over a context switch to view details in the tooltip. For example, in the Advanced Hotspots result above, the NtDelayExecution thread has the largest number of context switches caused by synchronization. When you select a context switch on the timeline, the Call Stack pane is updated to show a call sequence at which a preceding thread execution quantum was interrupted. |
Analyzing an Average Wait Metric
Click the (change) link to open the Hotspots viewpoint:

|
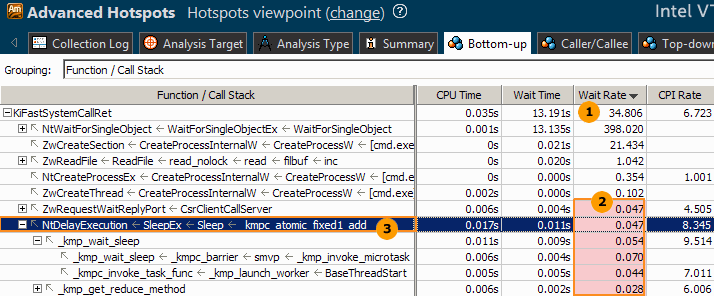
Analyze the Wait Rate metric data, that is average wait time (in milliseconds) per synchronization context switch. This metric helps you identify ineffective frequent synchronizations as well as power consumption issues. |
|
VTune Amplifier interprets low Wait Rate metric values (under 1ms) as performance issues and highlights them in pink. These values may signal an increased contention between threads and inefficient use of system API. |
|
Identify a synchronization stack with short Wait time and high CPU time (half the time of all system calls) and double-click it to explore the source code of the hotspot function. |
Analyzing Synchronization Context Switches
Click the (change) link to open to the Hardware Events viewpoint. By default, the Event Count grid is sorted by the Clockticks event. Identify the hottest functions that took the most CPU time (in clockticks) to execute and had the most frequent synchronization.

In this sample OpenMP* application, the VTune Amplifier identifies the InterpolateN function as a primary computation hotspot called from an OpenMP region. You can also see a major contention on the WaitForSingleObject inside the OpenMP runtime that results in ~ 30% of performance loss (Clockticks of the wait function / Clockticks of the hotspot function).
Double-click the InterpolateN function to view the source code and identify a cause of ineffective synchronization.

Code analysis for the sample application discovers excessive OpenMP barriers added to process a picture by blocks of lines and parallelize each block separately. To resolve this issue, use the nowait clause or apply parallel_for to the entire picture and use dynamic work scheduling.

For the optimized result, the relative cost of contention on Sleep() is low (26,997).
Using a single parallel_for and dynamic work scheduling for the WaitForSingleObject function helped decrease the contention and negative performance impact down to ~1%.
The second optimized result also discovers another highly contended function Sleep() (Synchronization Context Switches metric equal to 26,997). But if you check its execution time, it is within 2% of the top hotspot (not shown), which makes it less important. But this function may become an issue when running the application on a greater number of processors.
Note
The initial (pre-optimized) sample data collection session represented above was taken on a limited time interval. The optimized version represents a full application run.


