Configure your target for the KVM guest OS profiling.
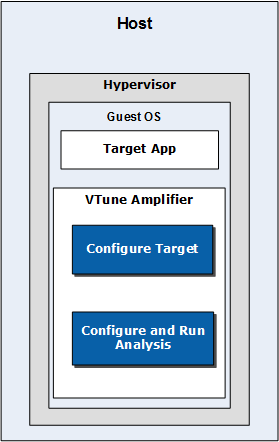
Intel® VTune™ Amplifier uses Perf*-based collection to enable performance analysis of the guest Linux* operating system via Kernel-based Virtual Machine (KVM) from the host system. Depending on your analysis target, you may choose any of the following usage models for KVM guest OS profiling:
Guest System and KVM Modules Analysis
If you are a system developer and interested in the performance analysis of a guest Linux* system including KVM modules, consider using this usage mode:
Additional information is available from Using VTune Amplifier with a Virtual Machine and Enabling VTune Amplifier Analysis on a KVM/XEN Project System.
To configure your analysis for KVM guest OS profiling, do the following:
Prepare your system for analysis:
Copy the /proc/kallsyms and /proc/modules files from a guest OS to a host file system to have KVM guest OS symbols resolved.
Copy any guest OS’s modules of interests (vmlinux and any *.ko files) from a guest OS and save them to a [guest] folder on the host file system.
Click the
 Configure Project button on the VTune Amplifier toolbar.
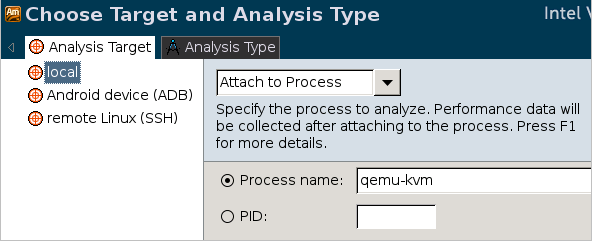
The Choose Target and Analysis Type window opens with the Analysis Target tab active.
Make sure to select the local target system in the left pane and configure the required target type in the right pane. By default, the Launch Application target type is selected.
If you select the Attach to Process target type, specify the qemu-kvm process to attach to:
Alternatively, you may specify the PID of the qemu-kvm process. To determine the PID, enter:
$ ps aux | grep kvm
Select the Analyze KVM guest OS option in the Advanced section and enter paths to the local copies of the guest /proc/kallsyms and /proc/modules files; for example:
Click the Binary/Symbol Search button on the right.
The Binary/Symbol Search dialog box opens.
Add a local path to a [guest] folder where all modules copied from the guest OS reside. For example, if your [guest] folder is located in /home/vtune, specify /home/vtune as a search directory:
Click OKto save your changes.
Click the Choose Analysis button on the right and select a required analysis type. For KVM guest OS profiling, you may choose analysis types using Perf*-based EBS data collection: Advanced Hotspots, System Overview, or configure your own custom analysis.
Click the Start button on the right to run the analysis.
When you run the analysis, the VTune Amplifier collects the data on both host and guest OS and displays merged statistics in the result. Guest OS modules have the [guest] postfix in the grid. For example:
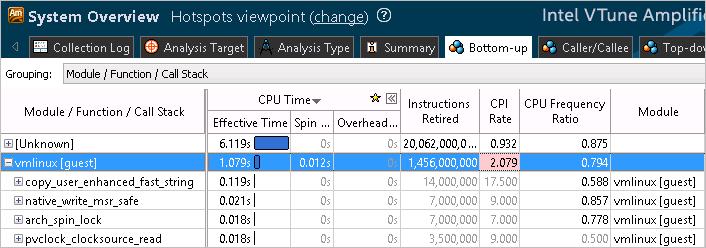
Note that the VTune Amplifier collects data only on the kernel space modules on the KVM guest OS. Data on user space modules shows up in the [Unknown] node and includes only high-level statistics. Call stack data is not collected for this type of profiling.
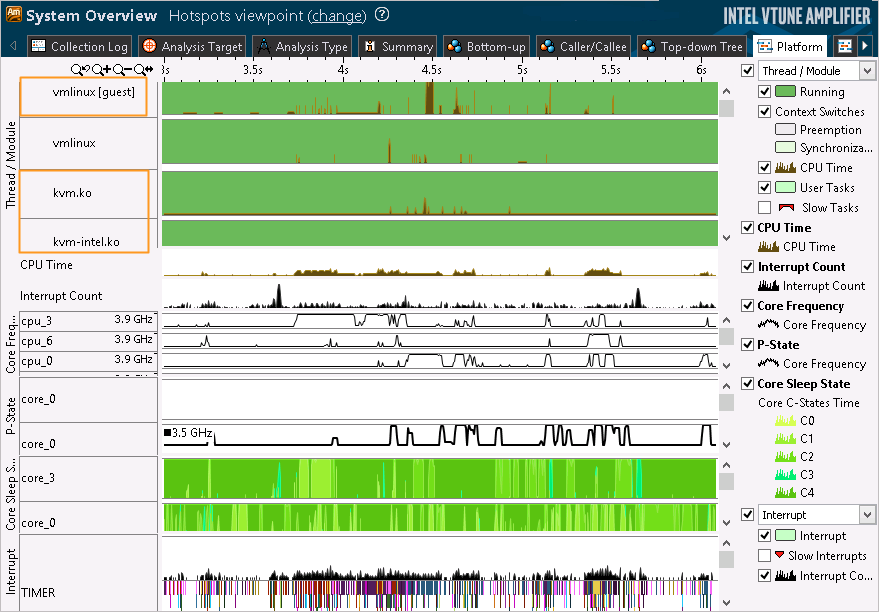
Focus on the Platform tab to analyze your code performance on the guest OS and correlate this data with CPU, GPU, power, hardware event metrics and interrupt count at each moment of time. If you enabled the kvm Ftrace event collection for your target, you can also monitor the statistics for KVM kernel module:
Application Analysis on the KVM Guest System
For application analysis, you need to install the VTune Amplifier directly on your guest OS. VTune Amplifier installation detects a virtual environment and disables sampling drivers installation to avoid system instability. When the product is installed, proceed with project configuration by specifying your application as an analysis target and selecting an analysis type:
If you select a hardware event-based analysis type (for example, General Exploration), the VTune Amplifier automatically enables a driverless event-based sampling collection using the Linux Perf tool. For this analysis, the VTune Amplifier collects only architectural events. See the Performance Monitoring Unit Sharing Guide for more details on the supported architectural events.
In the analysis result for this usage mode, you cannot see KVM modules and host system modules. Data on the guest OS and your application modules show up as locally collected statistics with no [guest] markers.