To access this window: Select the Platform Power Analysis viewpoint and click the Timer Resolution sub-tab in the result tab. The Timer Resolution window is only available for Windows* platforms.
Use the Timer Resolution to:
- View when timer resolution changes occurred during the collection.
- Analyze the time spent at each resolution.
Note
Platform Power Analysis viewpoint is available as part of Energy analysis. Energy analysis with the Intel® SoC Watch data collector is available for target Android*, Windows*, or Linux* devices and provided only with the Intel® VTune™ Amplifier for Systems.
Timer Resolution Pane
Total amount of time in seconds that the system spent at each timer resolution value. A value of 15.6 is the normal and recommended timer resolution in most cases. It is less energy efficient to spend a large amount of time at a lower timer resolution value because there are an increased number of wake-ups. You can change the unit displayed by right-clicking a data cell and selecting the Show Data As option to select an alternate unit. For example, you may want to change the unit to Percent to view the percent of time spent at each value and evaluate if it meets your expectations.
In the following example, most of the collection time was spent at a low timer resolution value of 4 ms. Applications generally request more frequent system timer wakeups like this to ensure a faster response. Such changes in the system timer should be restricted to critical regions in the application since it impacts the entire system. Use the Timeline pane to see which process or processes caused the change in timer resolution.

Timeline Pane
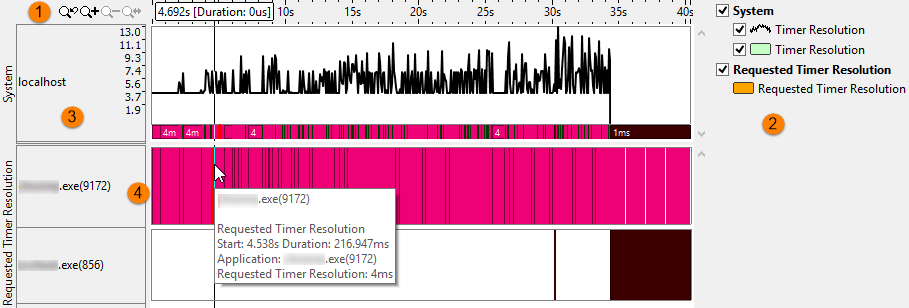
The Timeline pane shows a graphical representation of the timer resolution value changes and the duration each application spent at each resolution value.

 |
Toolbar | Navigation control to zoom in/out on the view on areas of interest. Filters applied on a timeline in one window are applied on all other windows within the viewpoint. This is useful if you identify an issue on one tab and want to see how the issue impacts the metrics shown on a different tab. For more details on the Timeline control, see Managing Timeline View. |
 |
Legend | Types of data presented on the timeline. Filter in/out any type of data presented on the timeline by selecting/deselecting corresponding check boxes. |
 |
System Timer Resolution | Timer resolution value changes over time. The black line illustrates the change in timer resolution. The colored bar at the bottom illustrates the duration at each timer resolution value. |
 |
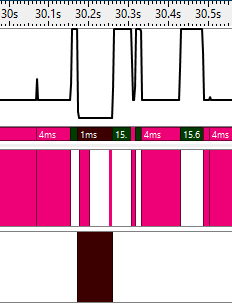
Requested/Application Timer Resolution | Requests for timer resolution change and duration by application. Hover over the timeline to view a tooltip listing information about the request, including start time, duration, application requesting the change, and requested resolution value (ms). Zoom in on the timeline to view changes in timer resolution value.  |