Intel® VTune™ Amplifier supports the Basic Hotspots and Locks and Waits analysis for Python* applications via the Launch Application and Attach to Process modes. For example, when your application does excessive numerical modeling, you need to know how effectively it uses available CPU resources. A good example of the effective CPU usage is when the calculating process spends most time executing native extension and not interpreting Python glue code.
To get the maximum performance out of your Python application, consider using native extensions, such as NumPy or writing and compiling performance critical modules of your Python project in native languages, such as C or even assembly. This will help your application take advantage of vectorization and make complete use of powerful CPU resources.
To analyze the Python code performance with the VTune Amplifier and interpret data:
Configuring Python Data Collection
You may use either GUI or command-line (amplxe-cl) interface to configure the VTune Amplifier for analyzing the performance of your Python code.
To configure and run Python code profiling from GUI, do the following:
Click the
 Configure Project button on the toolbar.
The Choose Target and Analysis Type window opens with the Analysis Target tab active.
From the left pane, choose a target system.
Note
Only Windows* and Linux* target systems are supported.
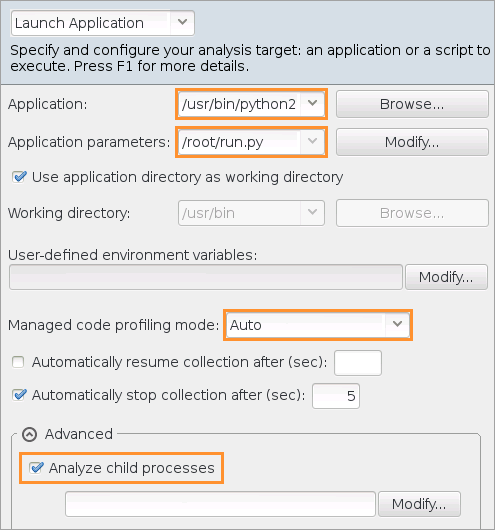
From the right pane, specify a path to the installed Python interpreter in the Application field and a path to your Python script in the Application parameters field.
Note
If you specify a relative path to your Python script in the Application parameters field, the VTune Amplifier properly resolves full function or method names only for the imported modules, and does not resolve the names inside the main script. Consider specifying the absolute path to the script.
In addition, you may select the Automanaged code profiling mode, and the VTune Amplifier automatically detects the type of target executable, managed or native, and switches to the corresponding mode. Optionally, you may select Analyze child processes option to collect data on processes launched by the target process.
In case your Python application needs to run before the profiling starts or cannot be launched at the start of this analysis, you may attach the VTune Amplifier to the Python process. To do this, select the Attach to Process target type and specify the Python process name or PID as follows:
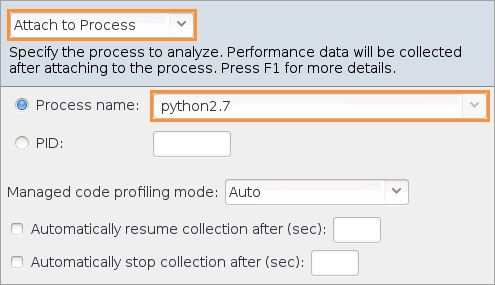
Note
When you attach the VTune Amplifier to the Python process, make sure you initialize the Global Interpreter Lock (GIL) inside your script before you start the analysis. If GIL is not initialized, the VTune Amplifier collector initializes it only when a new Python function is called.
Switch to the Analysis Type window and select the Basic Hotspots or Locks and Waits analysis type from the left pane.
Configure the following options, if required, or use the defaults:
CPU sampling interval, ms spin box
Specify an interval (in milliseconds) between CPU samples.
Possible values - 1-1000.
The default value is 10.
Analyze user tasks, events, and counters check box
Analyze the tasks, events, and counters specified in your code via the ITT API. This option causes a higher overhead and increases the result size.
The default value is false.
Analyze OpenMP regions check box
Instrument and analyze OpenMP regions to detect inefficiencies such as imbalance, lock contention, or overhead on performing scheduling, reduction and atomic operations.
The default value is false.
Details button
Expand/collapse a section listing the default non-editable settings used for this analysis type. If you want to modify these settings for the analysis, you need to create a custom configuration by right-clicking the analysis entry in the analysis tree and selecting Copy from Current from the context menu. VTune Amplifier creates an editable copy of this analysis type configuration and locates it under the Custom Analysis branch in the analysis tree.
For Locks and Waits, you may also select the Analyze Intel runtimes and user synchronizations option to analyze thread synchronization by profiling User Synchronization API used by Intel runtimes such as OpenMP* or Intel® Threading Building Blocks (Intel TBB).
Click the Start button on the right to run the analysis.
Identifying Hotspots
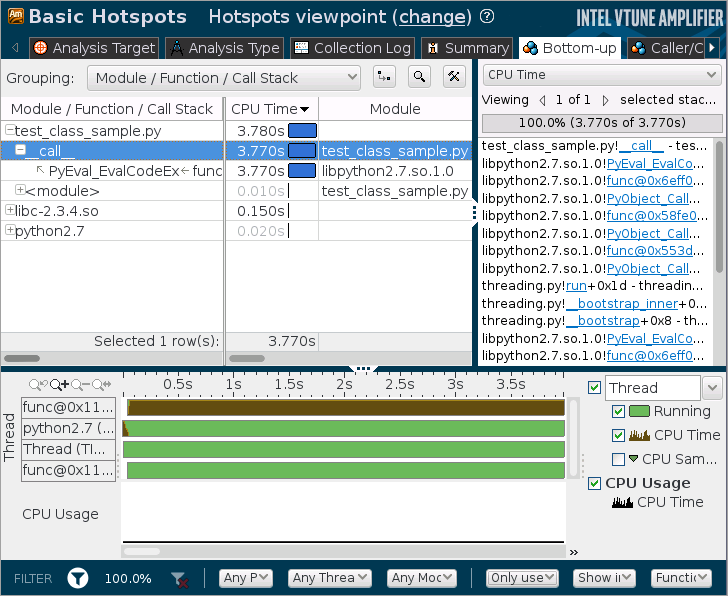
Basic Hotspots analysis helps identify sections of your Python code that take a long time to execute (hotspots), along with their timing metrics and call stacks. It also displays the workload distribution over threads in the Timeline pane.
Consider using Module / Function / Call Stack or Class / Function / Call Stack level in the Grouping menu to view analyzed data, since a typical Python application is logically divided into modules and is heavily class-oriented.
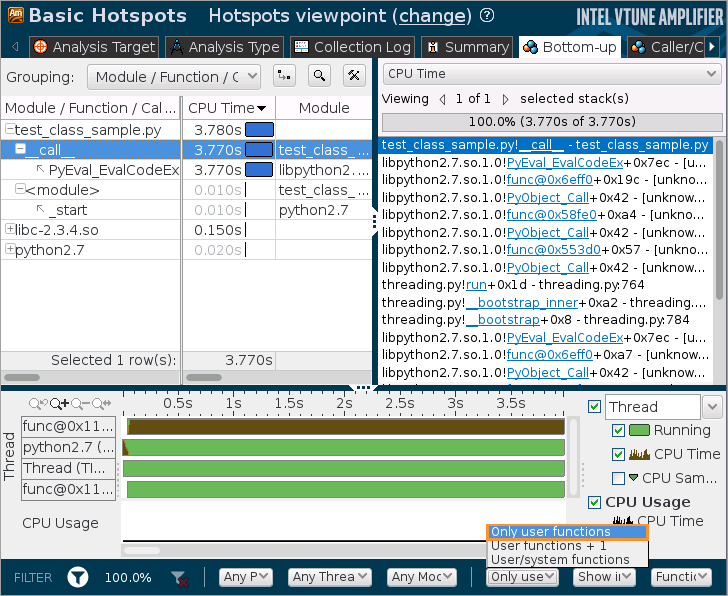
To view call stacks only inside your Python code, filter out Python core and system functions by selecting Only user functions option for the Call Stack Mode on the filter bar.
Limitations
VTune Amplifier supports Python code profiling with some limitations:
- Only Python distribution 2.6 and later are supported.
- If you use Python extensions that compile Python code to the native language (JIT, C/C++), the VTune Amplifier may show incorrect analysis results. Consider using JIT Profiling API to solve this problem.
- Python code profiling is supported for Windows and Linux target systems only.
- Proper thread names are not always displayed in the Timeline pane.
- If your application has very low stack depth, which includes called functions and imported modules, the VTune Amplifier does not collect Python data. Consider using deeper calls to enable the profiling.
- When collecting data remotely, the VTune Amplifier may not resolve full function or method names, and display the source code of your Python script. To solve this problem, copy the source files to a directory on your host system with a path identical to the path on your target system before running the analysis.